Keep recording long enough, and the numbers start speaking.
At Level 25 in the Goshuin Meguri app, the Statistics feature unlocks. Total visits, prefecture coverage, monthly pace, shrine-versus-temple ratio — the shape of your pilgrimage, which until now existed only as a felt sense in your hands and feet, appears on a single screen.
Most pilgrims who open Statistics for the first time share a similar moment: something like recognition. I’ve been going to eastern Japan the entire time. I only visit shrines in autumn. I’ve barely visited any temples. The goshuincho on the shelf doesn’t tell you this. The patterns are invisible inside individual pages, inside individual stamps. It takes aggregation — the act of seeing it all at once — to make the shape clear.
Statistics is not an analysis tool in the cold sense of the word. It’s a reward — the payoff for months or years of consistent recording. You reach Level 25 because you’ve been showing up: photographing goshuin, writing visit logs, leaving tips for other travelers. The numbers on that screen belong to you, because you put them there visit by visit.
This article explains what the Statistics feature shows, how to read the numbers, and how to use them to shape your next journey.
What Statistics Shows
The Statistics feature, unlocked at Level 25, displays a dashboard view of your entire pilgrimage record.
Reaching Level 25 is not quick. Features unlock progressively: Level 3 unlocks visit log posts, Level 10 unlocks Michishirube (tips) posting, Level 20 unlocks submitting stamp information, and Level 25 is when Statistics appears. By the time you get here, you have enough data for the view to mean something — this is partly by design.
What the Dashboard Displays
The Statistics screen organizes your visit data across several views:
- Total visits and total goshuin — the cumulative count of shrines and temples visited, and goshuin received
- Prefecture coverage map — a Japan map showing which of the 47 prefectures you’ve visited, with color intensity tied to how many times
- Monthly visit graph — visits plotted month-by-month, revealing seasonal rhythms
- Year-by-year trend — how your annual visit count has grown over time
- Shrine vs. temple ratio — the split between Shinto shrines and Buddhist temples in your visits
Together, these views answer a question that your goshuincho, however full it may be, cannot: What is the shape of this thing I’ve been doing?
The Statistics screen requires no interaction — it’s read-only. You look at it. That’s enough. Most people who open it find it difficult to leave quickly.
Total Visits and Total Goshuin: The Cumulative Count
The first numbers you see are the simplest: how many shrines and temples you’ve visited, and how many goshuin you’ve received.
Simple, but they carry weight. “87 visits. 74 goshuin.” Each number is the compression of real experience. The small mountain shrine reached after an hour of walking. The rainy-day temple in a town you happened to pass through. The urban shrine with the unexpectedly beautiful calligraphers. The first time you ever asked for a goshuin and weren’t sure you were doing it correctly.
The number doesn’t separate these out. It just says: 87. But you know what’s inside the 87.
The Milestones and What They Mean
Fifty visits. One hundred. Two hundred. These are the milestones where the cumulative count crystallizes into something felt as well as seen.
One hundred visits is often the first moment of genuine surprise. Many pilgrims who reach it hadn’t expected to. They started because a shrine looked interesting, or a friend suggested it, or they received a goshuincho as a gift and felt obliged to begin filling it. A hundred visits later, it has become a practice — something with its own rhythm and logic, separate from whatever started it.
The app issues achievement badges (omamori) tied to visit milestones. Unlocking these is a tangible marking of the threshold, but the more durable effect is internal: the number becomes part of how you describe yourself as a pilgrim.
The Gap Between Visits and Goshuin
Total visits and total goshuin rarely match.
Some shrines don’t offer goshuin, or the attendant was absent, or the office was closed. Sometimes you visited but decided against the goshuin that day — you just wanted to be present in the space without the transaction. The gap between visits and goshuin is a small portrait of your relationship with the practice: whether goshuin collection is the purpose or the record-keeping is incidental to something else.
A large gap tends to indicate a pilgrim who visits shrines and temples for reasons beyond the stamps. A small gap tends to indicate someone for whom the goshuin practice is central and deliberate. Neither reading is a judgment. The numbers describe; they don’t evaluate.
The Prefecture Map: Finding Your Blank Spaces
If Statistics has a feature that generates the most sustained attention, it’s the prefecture coverage map.
Japan’s 47 prefectures are displayed on a map of the country. Prefectures where you’ve visited at least one shrine or temple take on color; prefectures with higher visit counts show deeper color. Prefectures with no visits remain white.
What the Color Gradient Tells You
The gradient reveals something the flat list of shrine names cannot: the geography of your practice.
Most pilgrims find strong color around their home region and major cities. Tokyo, Osaka, and Kyoto are densely colored early, because they are densely packed with notable shrines and temples and are visited frequently. Prefectures a few hours away tend to fill in on weekend trips. The distant prefectures — those that require overnight travel or a dedicated journey — often stay white or pale for years.
“I’ve been going to Kanto and Kansai the whole time, and barely touched Tohoku or Shikoku” is one of the most common discoveries. The goshuincho doesn’t announce this. The map does.
The Goal of Complete Coverage
A significant subset of pilgrims make complete prefecture coverage — filling all 47 — a long-term goal.
The mechanics are straightforward: visit at least one shrine or temple in each prefecture. In practice, the final dozen or so prefectures require deliberate travel planning. Some prefectures (those with famous destination shrines or temples) fill in early and easily. Others require the prefecture itself to be the destination, not just a location you passed through.
Shimane and its Izumo Taisha, one of Japan’s most significant shrines for en-musubi (ties between people). Miyazaki and its Udo Jingu, carved into seaside cliffs. Tottori, Saga, Kochi — prefectures that become reasons for a journey only when you decide they will.
The map turns the blank spaces from absences into invitations.
Counting Coverage
“31 out of 47 prefectures” is concrete and meaningful to other pilgrims. The number also sets up the next calculation: “If I take a trip to Kyushu, I could cover four prefectures in one journey.” The map makes this planning intuitive.
The Monthly Graph: When Do You Actually Visit?
The monthly visit graph plots your shrine and temple visits by calendar month, accumulated across all years of your record. The patterns that emerge are almost always unexpected.
The Universal Peaks
Two peaks appear in most pilgrims’ graphs with enough regularity to qualify as near-universal: January and autumn (October–November).
January’s peak is driven by hatsumode — the traditional new year’s shrine visit. Even people who don’t identify as deliberate pilgrims tend to visit a shrine during the first days of January. The custom is embedded deeply enough in Japanese culture that it pulls most people to a shrine at least once, regardless of whether they’ve brought their goshuincho.
The autumn peak reflects the particular appeal of temples and shrines during fall foliage season. Maple leaves turning red against temple rooftops; the smell of incense in cool air; the raked gravel of a Zen garden covered lightly with fallen leaves. This aesthetic alignment between the setting and the season draws visitors who might not come at other times of year.
The valley between June and August reflects heat and rain. Shrine paths are often long, exposed, and unpaved — conditions that discourage outdoor visits during Japan’s rainy season and summer heat.
Year-Over-Year Growth
The year-by-year view shows how your annual visit count has changed since you began recording. The growth is often dramatic when seen from enough distance.
Year one: 18 visits. Year two: 27. Year three: 41. Year five: 68. The numbers are dry. What they represent is the compounding of habit — the way a practice becomes easier and more natural the longer it continues. The same effort that produced 18 visits in year one produces 68 in year five, because the friction has dropped: you carry a goshuincho reflexively, you know how to navigate a shrine without uncertainty, you recognize when a detour is worth taking.
The year-by-year view makes this arc visible.
Shrine vs. Temple Ratio
Japan has approximately 80,000 Shinto shrines and 77,000 Buddhist temples — nearly equal in number. Most pilgrims’ visit ratios are not even close.
Shrine visits tend to dominate, for reasons embedded in the structure of Japanese religious culture. The major annual events that bring people to sacred spaces — New Year’s, Shichi-Go-San (child milestone ceremonies), Shinto weddings — are primarily shrine-based. Funerals and memorial rites, which bring people to temples, are less likely to produce goshuin visits.
The Discovery Moment
“I’ve been 80% shrine, 20% temple the whole time” is a finding that surprises most pilgrims who encounter it, not because it seems wrong but because it was invisible until the number appeared.
This doesn’t mean anything needs to change. The ratio is descriptive, not prescriptive. But for pilgrims who feel they want to deepen their engagement with Buddhist temple traditions — the meditative spaces of Zen gardens, the incense-and-sutra culture of Kansai temples, the mountain pilgrimage routes that pass through ancient monasteries — the ratio gives a concrete starting point: “I haven’t gone to many temples. Where would I start?”
The ratio is a map of what you haven’t yet done. It points toward the same kind of specific invitation as the blank spaces on the prefecture map.
Using Statistics to Plan Forward
Statistics is most valuable when it faces forward as well as backward.
Targeting the White Prefectures
The simplest application: pick one white prefecture and build a trip around it.
This transforms the absence into an itinerary. Shimane — white on many pilgrims’ maps — is home to Izumo Taisha, one of Japan’s most important shrines, as well as Miho Shrine and Yaegaki Shrine. A two-day trip to Shimane fills the prefecture, yields multiple goshuin from historically significant locations, and opens a part of Japan that few international visitors reach.
The white spaces on the map are not failures. They are the remaining chapters.
The Monthly Pace Target
Pilgrims who notice their visits clustering in October–November and January might decide to spread more evenly across the year.
“One visit per month” is a modest and achievable target for most pilgrims with reasonable proximity to shrines or temples. The monthly graph makes the target concrete and the progress visible. When April arrives and the April bar is still at zero, the graph creates light accountability — not guilt, but awareness. You know the year’s pattern is forming.
Consistent monthly visiting also creates different kinds of visits. The high-energy autumn foliage visit and the January New Year’s crowd are replaced by a Tuesday afternoon in February at a neighborhood shrine, snow on the path, the smell of incense stronger than usual in cold air. These visits are smaller but accumulate differently.
Building Theme Pilgrimages
The statistics view can suggest thematic gaps as naturally as geographic ones. A pilgrim who has mostly visited Inari shrines might decide to seek out the three major Inari shrines (Fushimi Inari Taisha, Toyokawa Inari, Kasama Inari) deliberately. A pilgrim with a high temple ratio might take on one of the formal pilgrimage circuits — the 33 Kannon temples of the Saigoku route, or the 88 temples of Shikoku.
The numbers tell you what you’ve done. They also suggest what you could do next.
Summary
The Statistics feature in Goshuin Meguri — unlocked at Level 25 — turns accumulated visit records into a legible view of your pilgrimage.
Total counts. Prefecture maps. Monthly rhythms. Shrine-temple ratios. Each view offers a different angle on the same underlying data: years of visits, recorded and kept.
The numbers don’t tell you whether you’ve been doing it well. They tell you how you’ve been doing it — which places, which seasons, which proportions of shrine to temple. They reveal patterns that weren’t visible from inside any single visit.
Then they do something more useful: they suggest what comes next. The white prefectures invite. The sparse months beckon. The underrepresented temple tradition opens toward Koyasan, Nara, the Shikoku pilgrimage.
Statistics is not a destination. It’s a compass — one that only works because you’ve already walked.
Related Articles
- Goshuin Meguri App Guide | How to Record and Enjoy Your Shrine Visits
- Why You Should Manage Your Goshuin Digitally
- Goshuin App Comparison: Why Choose Goshuin Meguri
- 10 Tips for Collecting Goshuin
Image Credits
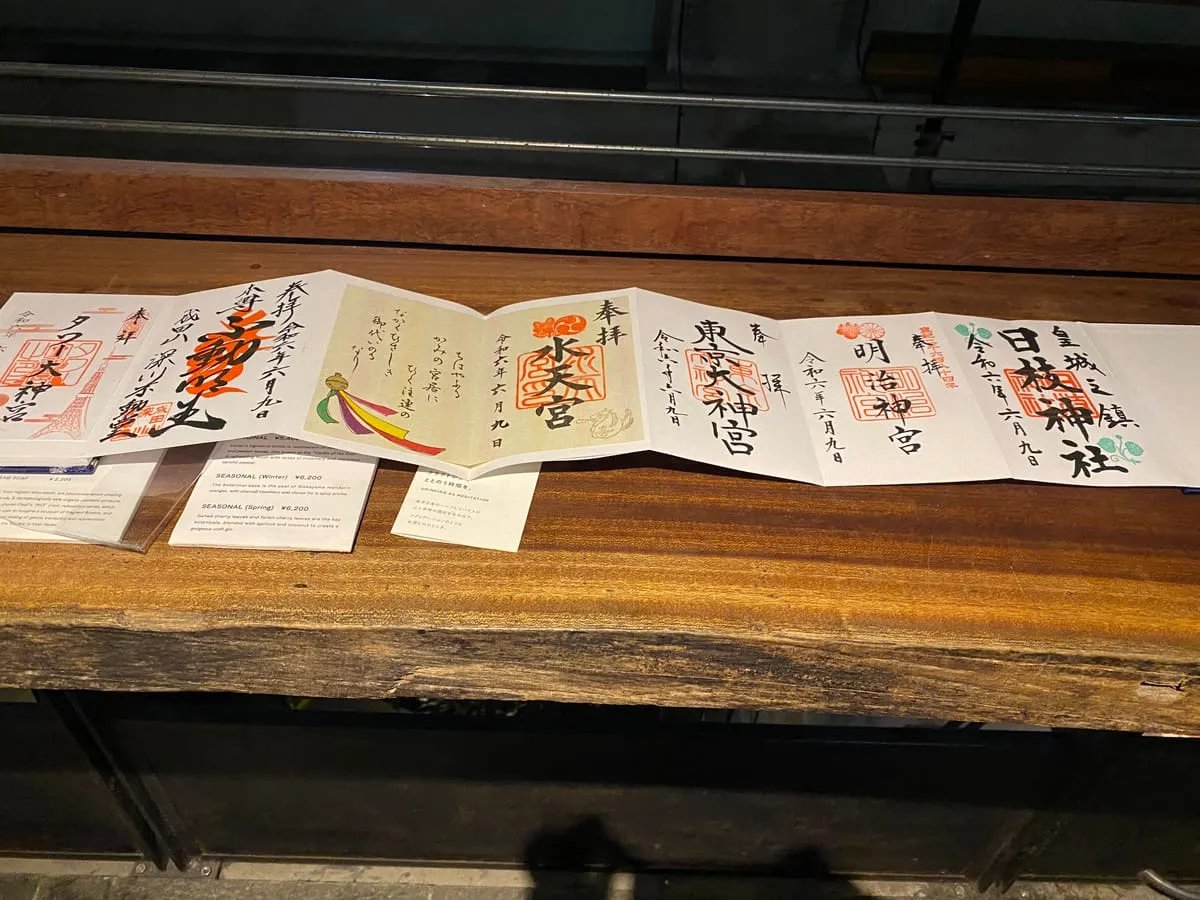
- Goshuincho open to stamps (Tokyo): Immanuelle, CC BY 4.0, via Wikimedia Commons
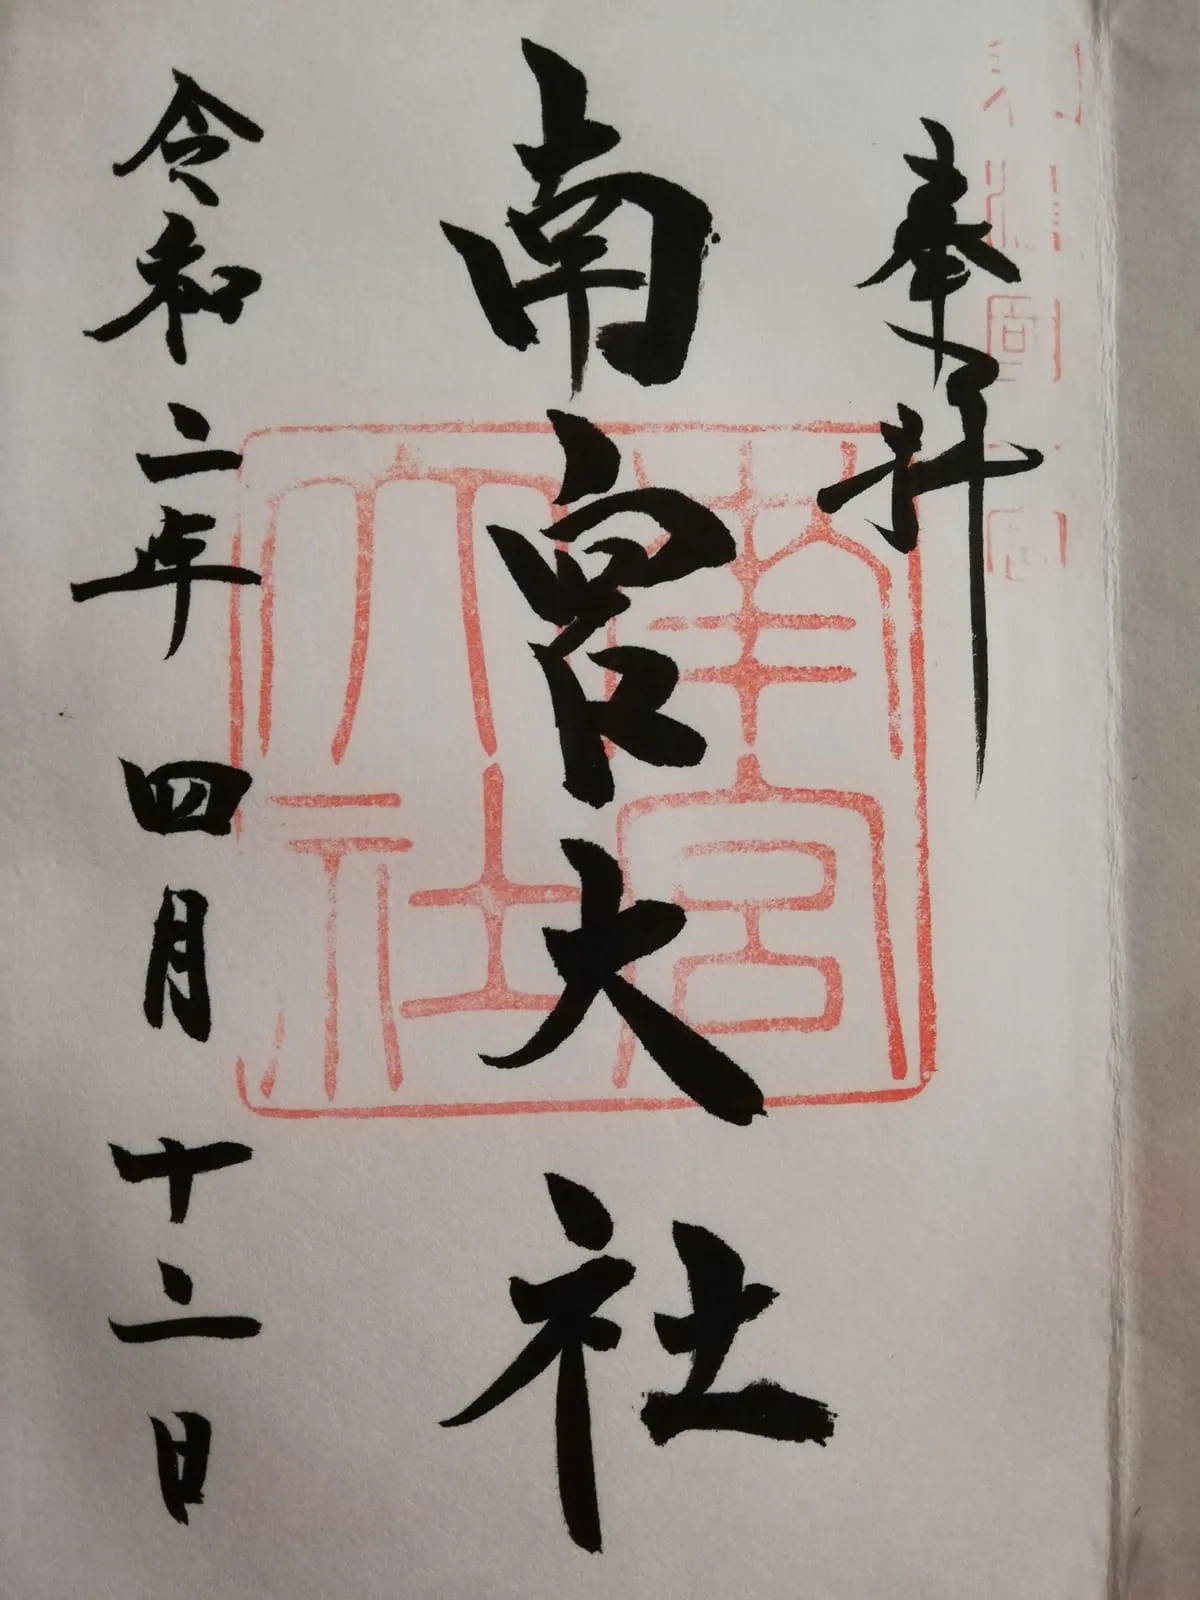
- Nangu Taisha goshuin (Gifu Prefecture): 先従隗始, CC BY-SA 4.0, via Wikimedia Commons
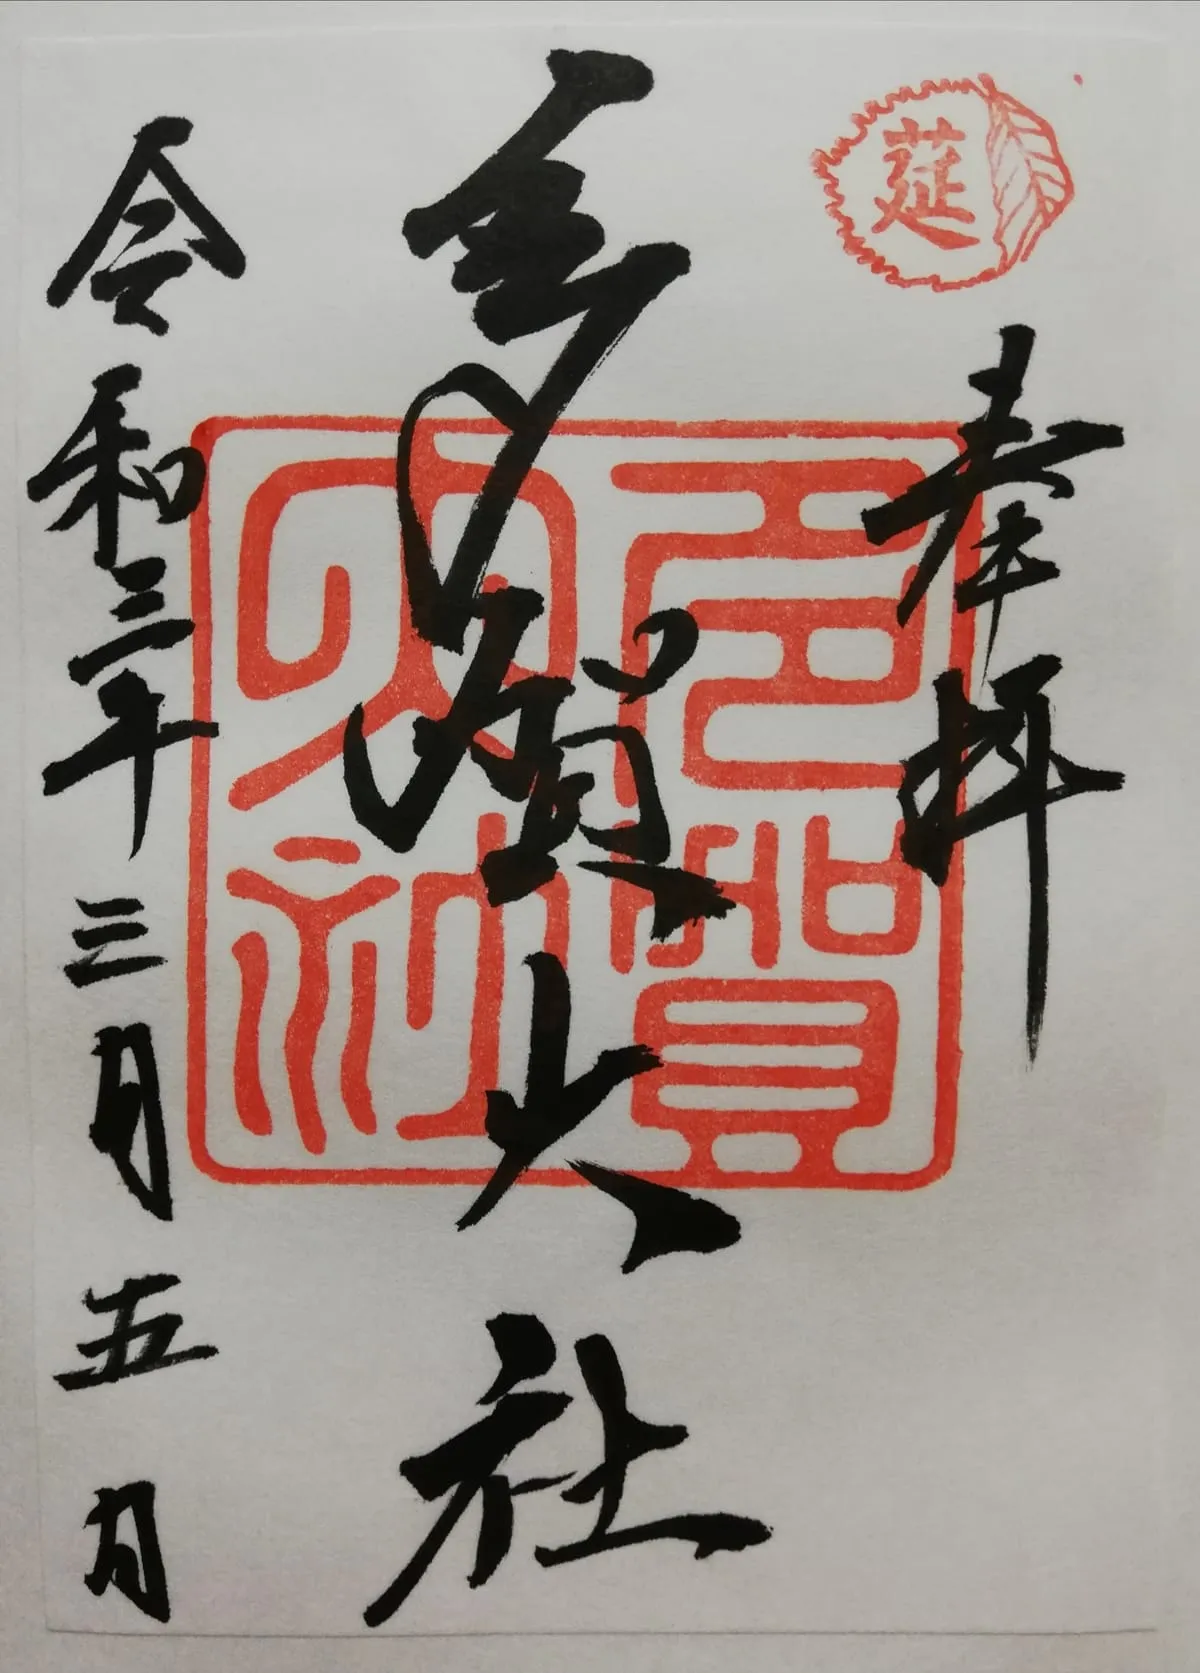
- Taga Taisha goshuin (Shiga Prefecture): 先従隗始, CC0 1.0, via Wikimedia Commons